Wildfire Analysis by Watershed Regions in Colorado
General ·Looking at statistics and changes in time of wildfires that occur in HU2 and HU4 watershed regions in Colorado.
Data Choice
As I discussed in my last project, forests are struggling to recover, especially in parts of Colorado.
There is another part to the devastation of wildfires as of late. Wildfires are changing with time, for the worse. Increases temporarlly and spatially are having system-altering effects throughout the U.S. Here are some articles if you would like to learn more.
- The New York Times on increases in large wildfires in the Western US
- Adapt to more wildfire in western North American forests as climate changes
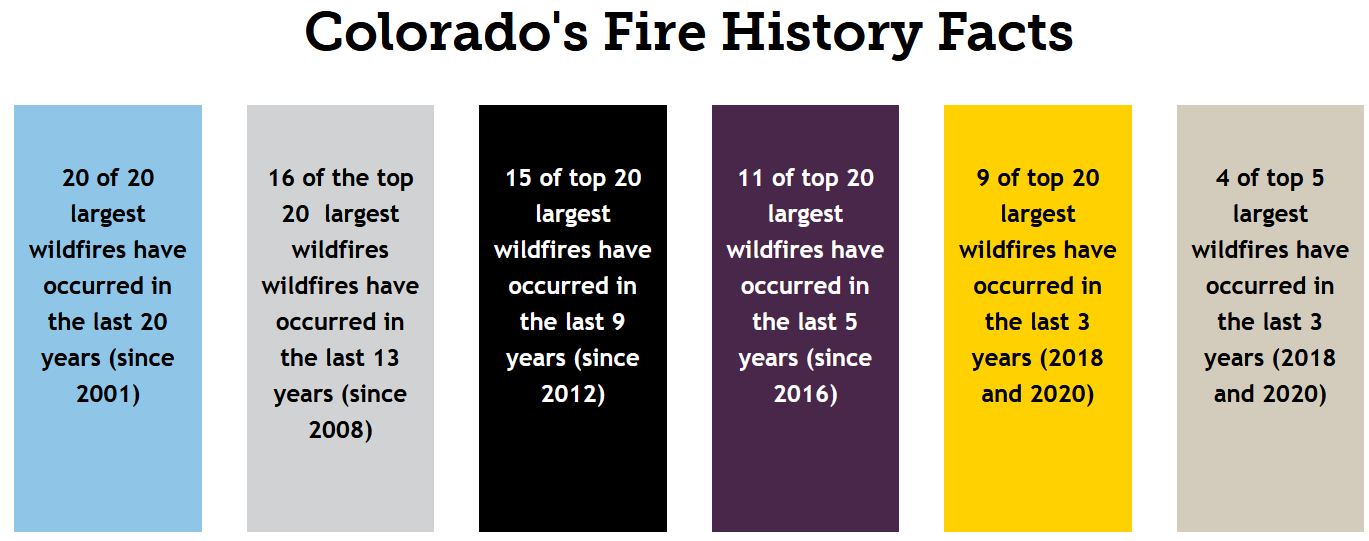
As I live in Colorado, I wanted to investigate how this is affecting my state. The graphic below is from the State of Colorado- Division of Fire Prevention & Control, Historical Wildfire Information section of their website. We can see the same facts, fires are becoming more frequent and larger.

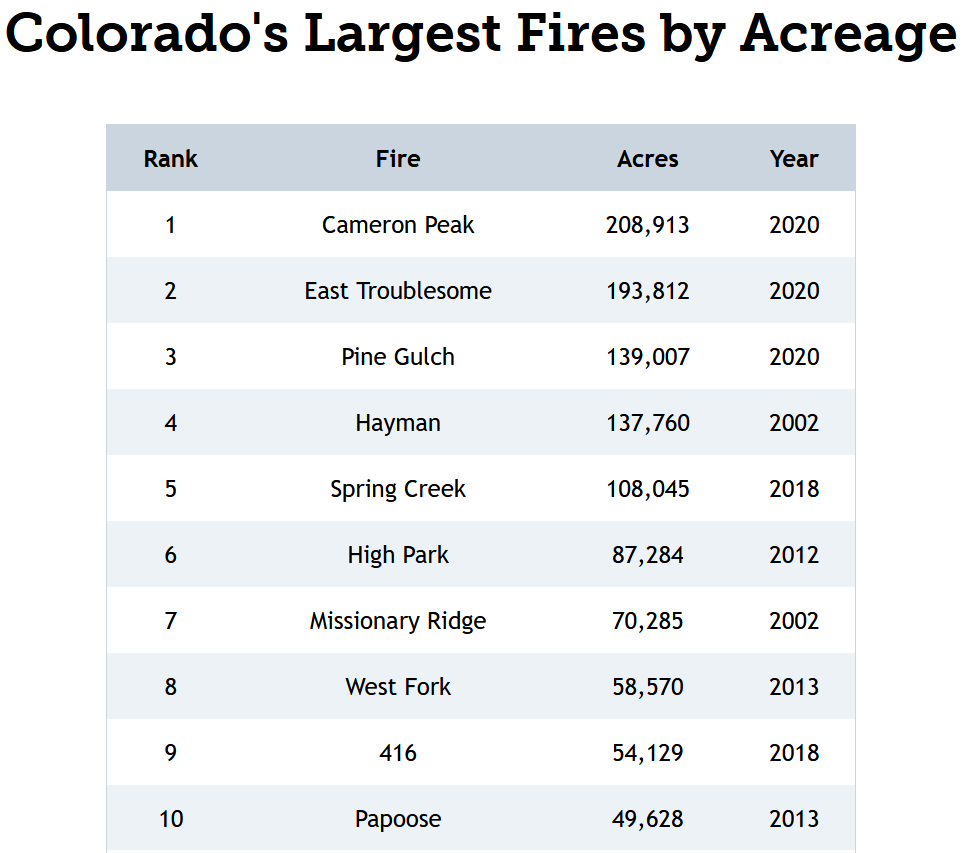
In terms of wildfire size, here is an example of the top 10 largest fires in Colorado in terms of acreage.

I wanted to look at time series of total numbers of fires and max fire sizes, specifically within Colorado. One way to do this is to take water regions that go through CO and copmare it to a database that contains wildfire information by watershed, specifically to see if it is better to represent the regions within CO with one hydrologic unit classification level over another.
Data at a Glance
Hydrologic Units (HU) and Watersheds
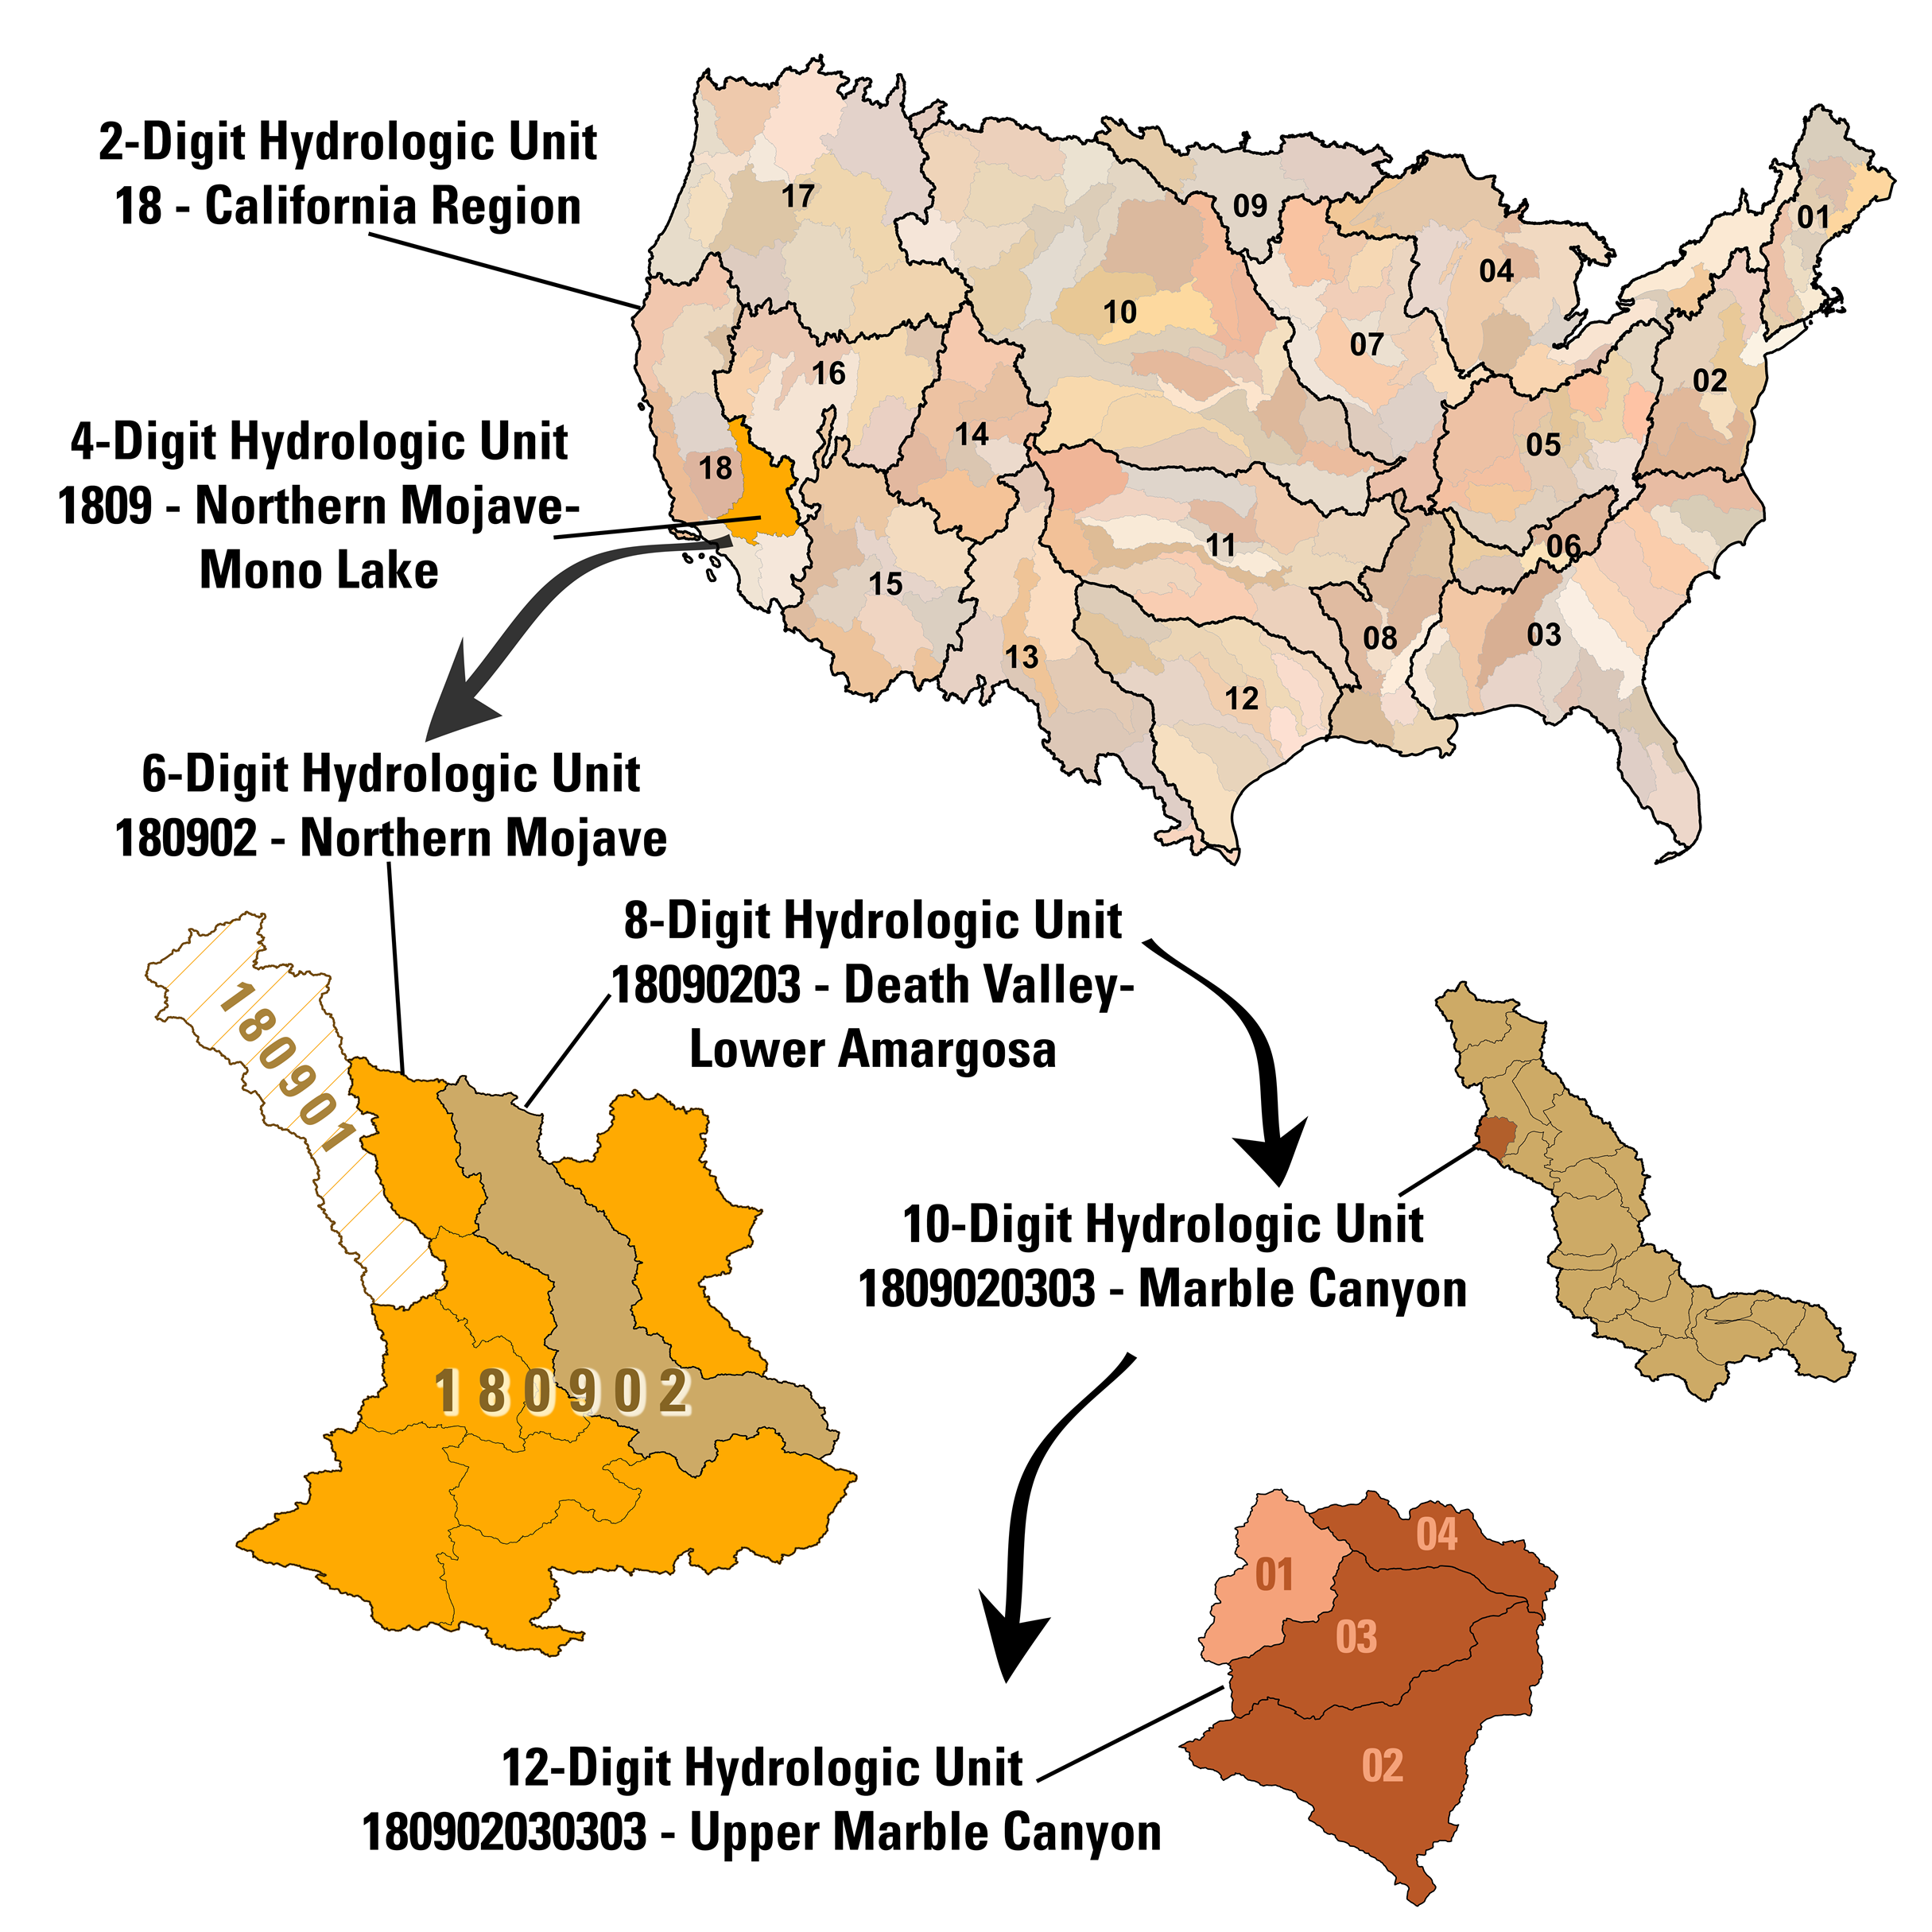
The United States is organized into a hierarchy of hydrologic units, which can be categorized into four distinct levels: regions, subregions, accounting units, and cataloging units. These hydrologic units are structured in a nested fashion, with larger geographic areas at the top (regions) and smaller geographic areas at the bottom (cataloging units). Each hydrologic unit is uniquely identified by a hydrologic unit code (HUC) comprising two to eight digits, corresponding to the four levels of the hydrologic unit system.
At the initial classification level, HUC-2, the country is partitioned into 21 major geographic regions. These regions encompass either the drainage basin of a major river, such as the Missouri region, or the collective drainage areas of multiple rivers, as exemplified by the Texas-Gulf region, which includes numerous rivers that flow into the Gulf of Mexico. Eighteen of these regions are situated within the contiguous United States, with Alaska representing region 19, the Hawaiian Islands constituting region 20, and Puerto Rico and other peripheral Caribbean areas forming region 21.
Moving to the second classification level,HUC-4, the 21 regions are further divided into 221 subregions. Each subregion encompasses the land drained by a river system, a segment of a river and its associated tributaries, a closed basin or basins, or a cluster of streams that collectively form a coastal drainage area.
A great example comes from the USGS NAS FaST - Flood and Storm Tracker Website. It shows each scaled of the different classification levels.

I will be analyzing at HUC-2 and HUC-4 levels and getting my data from the Watershed Boundary Dataset (WBD) website.
Spatial Wildfire Occurrence Data for the United States
Data on CONUS fire occurrence between 1992 and 2020 was used from the the United States Forest Service website
This data release presents a spatial database documenting U.S. wildfires from 1992 to 2020, supporting the Fire Program Analysis system. The dataset includes 2.3 million geo-referenced wildfire records, covering 180 million burned acres, and conforms to NWCG standards, with redundant records removed. It facilitates linking final fire reports with large fire perimeters and operational situation reports.
Data Analysis
To begin, I looked at the interaction between the watershed boundaries and the State of Colorado at the HUC-2 level.
The HUC-2 level covers an area that is much larger than Colorado, so I began by clipping the watersheds to only be within the borders of CO.
At the HU2-level, the watershed boundaries may not give enough detail as to what is actually happening in each part of the state, so I also wanted to analyze the HUC-4 level watersheds. As we can see below, there are far more regions that can help us to better classify the fires that occur in each of these regions.
Then, I wanted to look at the total number of fires that occured in each area each year, as well as where the largest fire occured each year. I created some tire series line plots to look at this data, first for the HUC-2:
Followed by same using the HUC-4 data:
To better visualize all of the regions data at once, I also created a combined region line plot for HUC-2 and HUC-4. If you would also like to see specific regions combined, or singled out, click on their names to toggle thhe data for those regions on/off.
Finally, I also wanted to look at fire density of each region. The units are in terms are hectacres, as they are primarily used as a measurement of land.
First for HUC-2, and then for HUC-4
Results
Comparing the data, we see large differences between HUC-2 and HUC-4, which we surprised in our hypothesis. It leads us to continue thinking about the issues of aliasing. With the HUC-2 data, the fire density for the entire western-half is higher than anywhere else, but as we move down in region size to HUC-4, we see that one or two regions are carrying the bulk of that weights. Where-as, if we moved down in scale too much, it would not be tell us enough large-scale information about each region.
For the second part of our hypothessis, we do find that the graphic from USGS detailing the spatial and temporal increase in wildfires is indeed true.
Data Citations
Short, Karen C. 2022. Spatial wildfire occurrence data for the United States, 1992-2020 [FPA_FOD_20221014]. 6th Edition. Fort Collins, CO: Forest Service Research Data Archive. https://doi.org/10.2737/RDS-2013-0009.6
Watershed Boundary Dataset (WBD). U.S. Geological Survey / USDA Natural Resources Conservation Service / U.S. Environmental Protection Agency. https://data.nal.usda.gov/dataset/watershed-boundary-dataset-wbd. Accessed 2023-10-11.
