NDVI Analysis and Working with Raster Data
General ·Using NDVI raster data to analyze vegetation regrowth after the Royal Gorge Fire that occurred in 2013 just outside of Cañon City, CO.
Data Choice
A popular attraction in the mountains of CO, west of Pueblo, is the Royal Gorge Canyon Train and Suspension Bridge. My family had a trip planned to go back for the first time in a decade. The week before we went, a fire sparked and the park shut down, for 9 months. Even after that, everyone who went told us that it was sad to see the once lively park covered in burn marks. It has now been another decade since the fire and when choosing a dataset to analyze, I was curious to see how long it took for the landscape to recover. Below I analyze NDVI data to assess vegetation regrowth in the area where the fire occurred. Watch the following video to see how the Royal Gorge park fared after 10 years.
Data at a Glance
Royal Gorge Fire Quick Facts
- First reported at 1pm June 11th, 2013.
- 3,218 acres burned.
- 32 out of 1,292 wooden planks burned on the Royal Gorge Bridge.
- 48 out of 52 buildings in the Royal Gorge Bridge and Park were lost.
- The Royal Gorge Bridge and Park was closed for 9 months.
- The Royal Gorge Fire was fully contained on June 16th, 2013.
- No injuries were reported, and no residential homes were lost.
- Cost to rebuild park: $30 million
- About 25,000 pounds of native grass and wildflower seeds were planted.
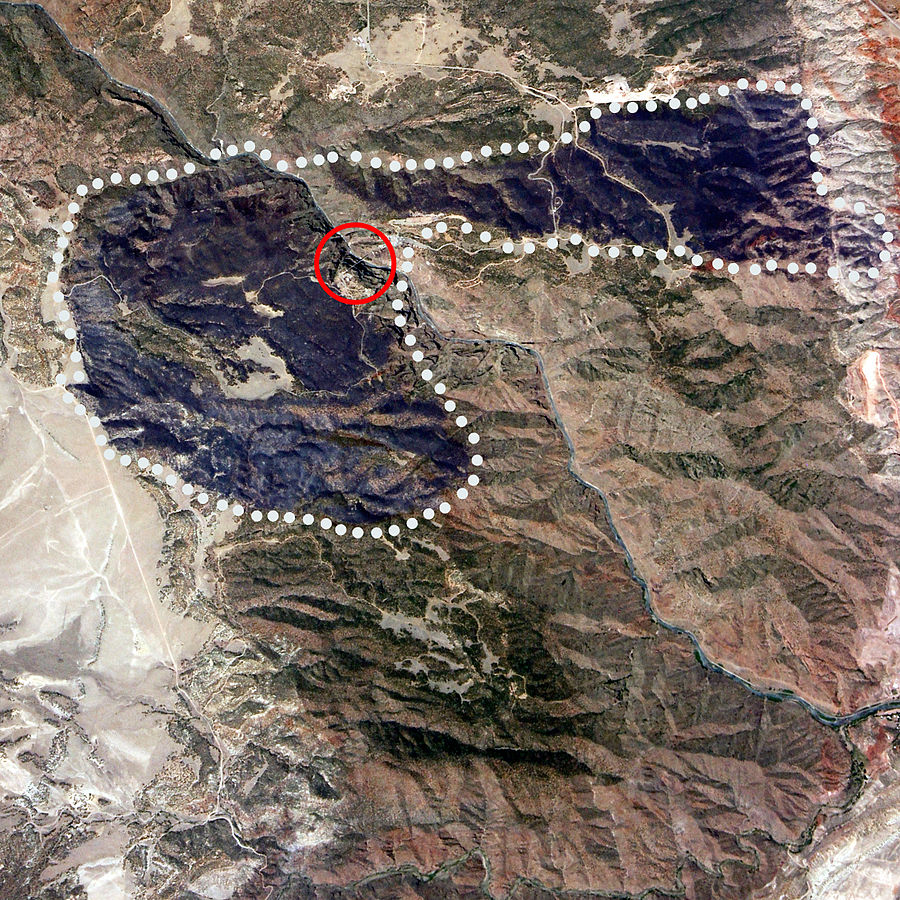
The image below that was taken in 2013 and outlines the fire boundary in white dots with a red circle where the suspension bridge occurs from Wikipedia

Why NDVI for Vegetation Analysis
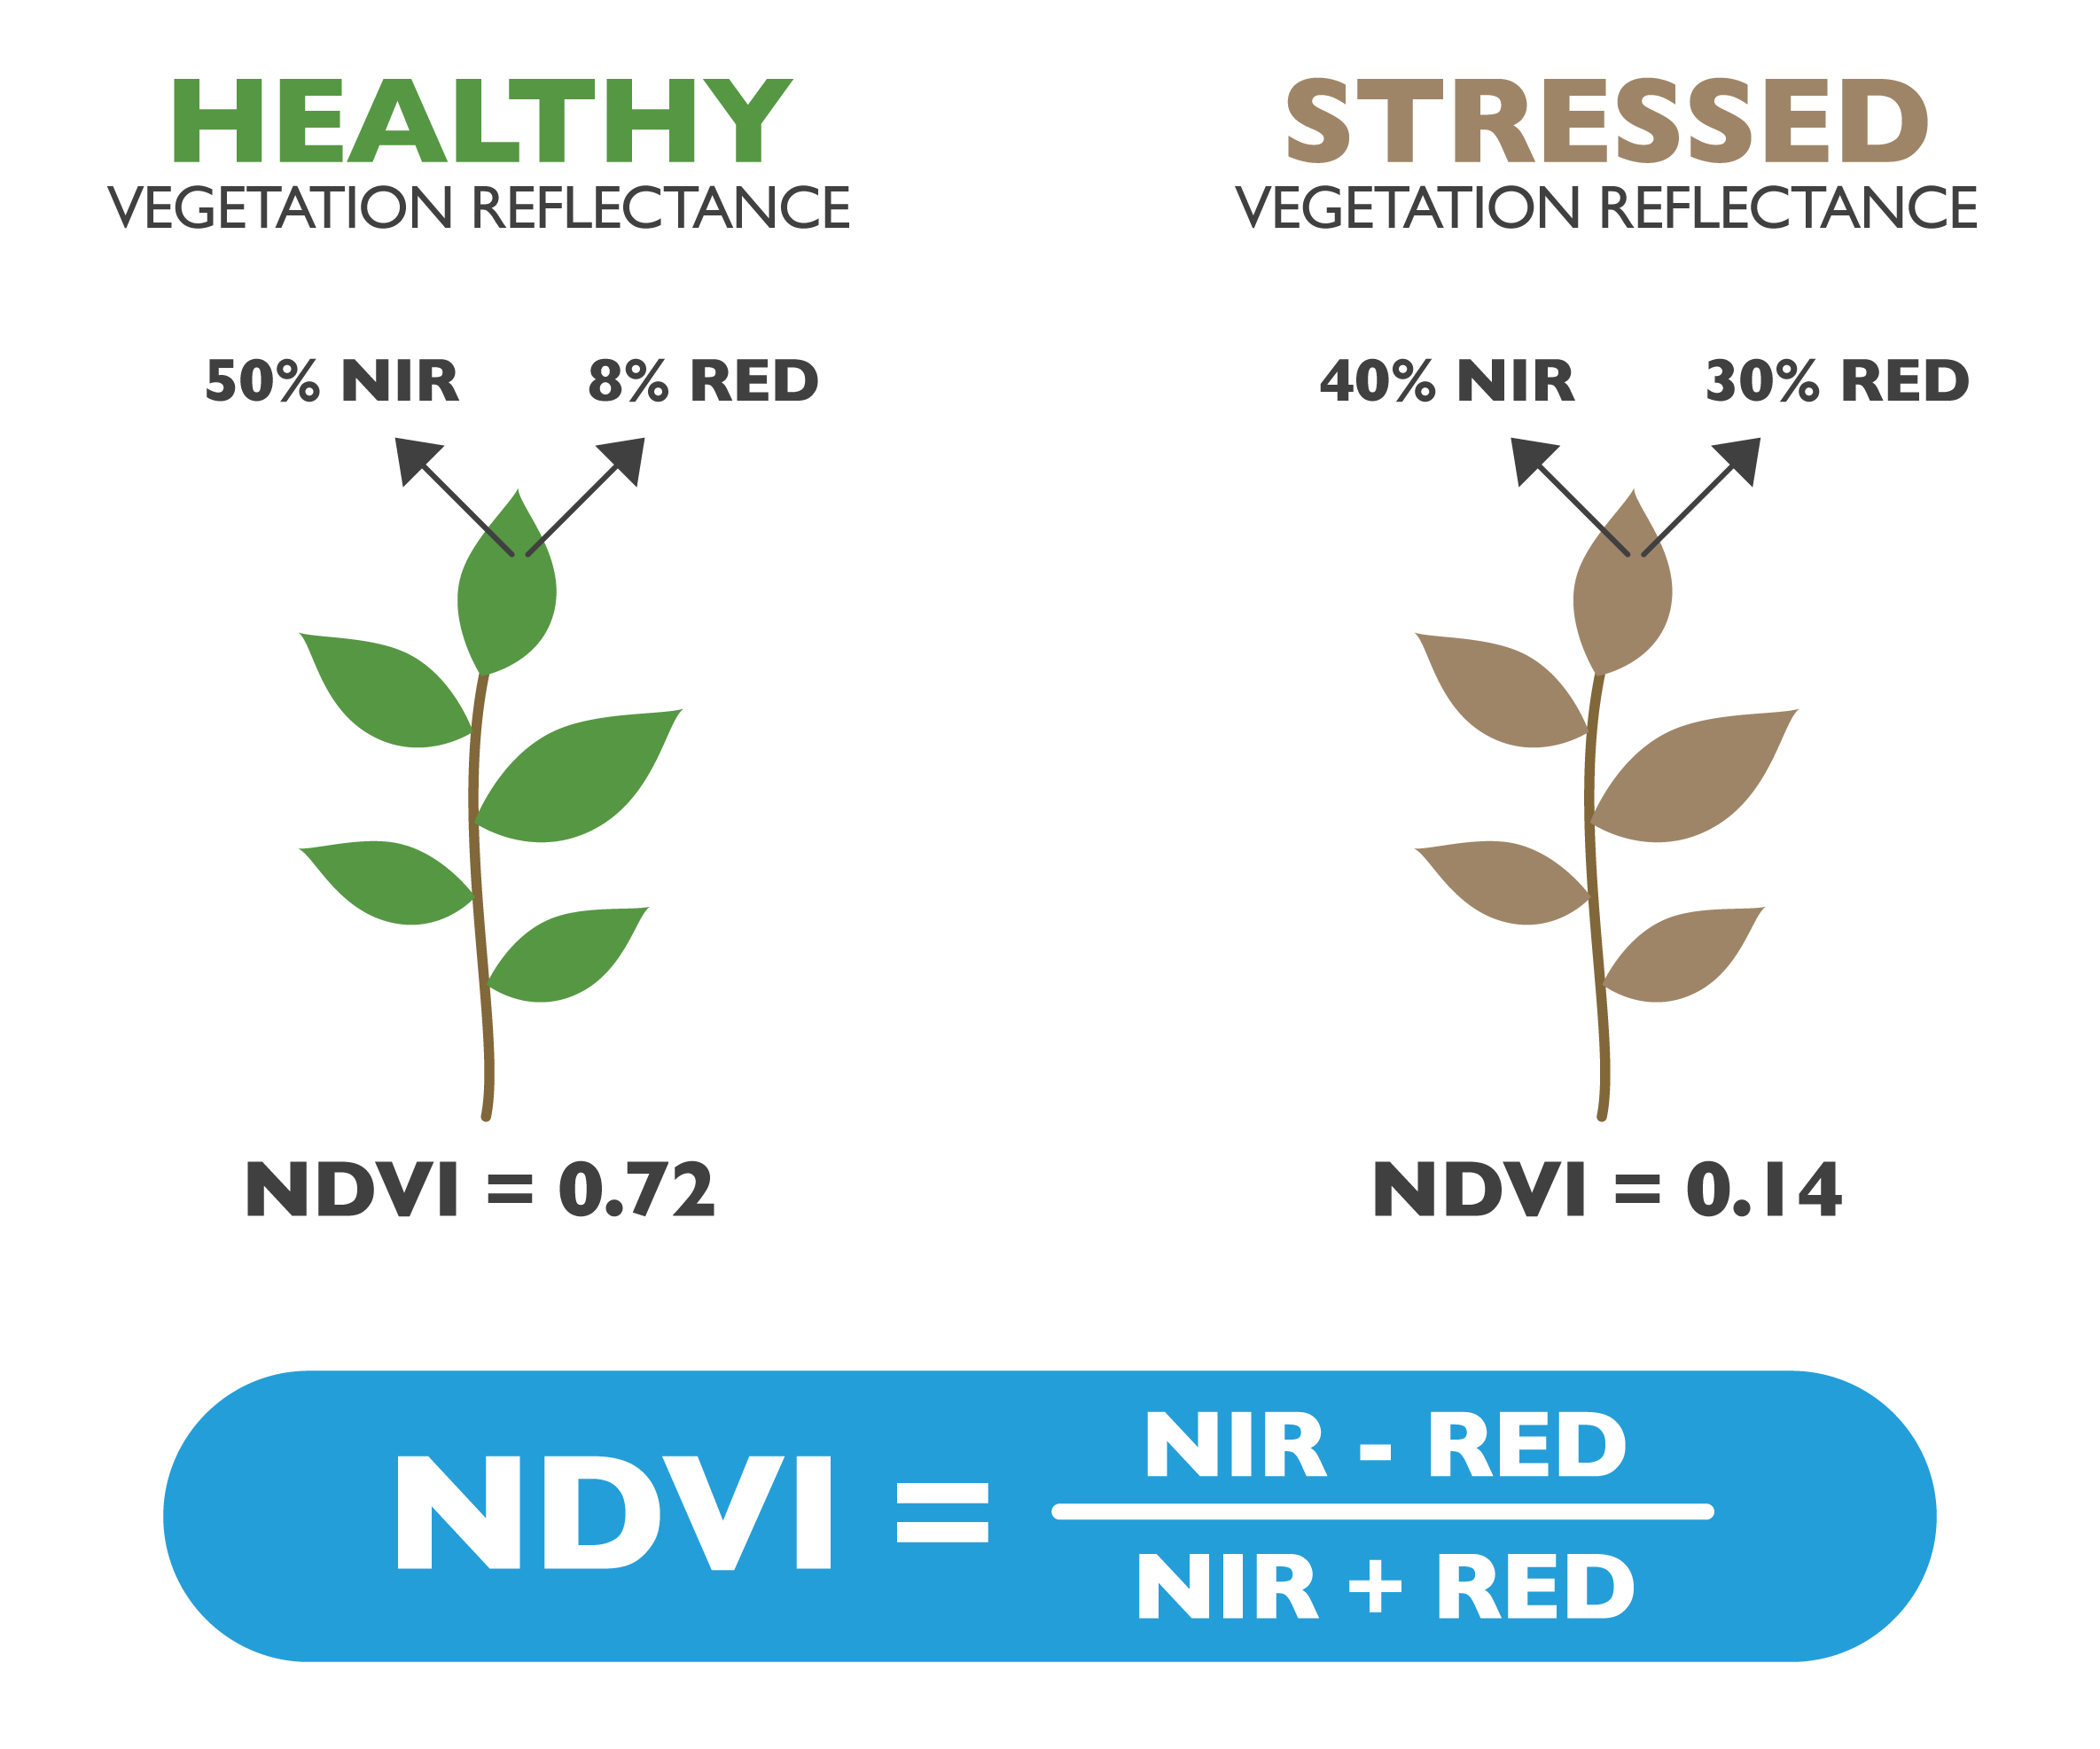
Normalized Difference Vegetation Index (NDVI) quantifies vegetation by measuring the difference between near-infrared (which vegetation strongly reflects) and red light (which vegetation absorbs). Healthy vegetation (chlorophyll) reflects more near-infrared (NIR) and green light compared to other wavelengths. But it absorbs more red and blue light. This is why our eyes see vegetation as the color green. If you could see near-infrared, then it would be strong for vegetation too.

Written mathematically, the formula is:
NDVI = (NIR — VIS)/(NIR + VIS)
Calculations of NDVI for a given pixel always result in a number that ranges from minus one (-1) to plus one (+1); however, no green leaves gives a value close to zero. A zero means no vegetation and close to +1 (0.8 - 0.9) indicates the highest possible density of green leaves.
Data Analysis
To begin, I acquired the raster data from Wildland Fire Interagency Geospatial Services (WFIGS) Historic Perimeters 2013 API explorer site and downloaded it using the APPEEARS API (Application Programming Interface) for the royal gorge location and looked at the NDVI.
First, I looked at the NDVI difference for the immediate pre-fire and post-fire years, 2012 to 2014.
We can see some areas with very clear differences in the NDVI spatially, in order to get a better idea as to where the edges of the fire were, I next plotted the boundary of the fire on top of the NDVI plot. Then I expanded the data to be from 2010 to 2023, so we can get a better picture of the full effects of the fire.
To get a better understanding of the values we are seeing, I also then created a histogram to see the spread of values, for the same parameters as the above plot.
In order to take into account if the fire dropped more inside the boundary than outside over the last decade, I plotted these values from 2010 - 2023 and show a vertical line where the fire occurred on the plot below as well. Despite 25,000 pounds of planting wildflowers and grasses being planted in the area, the area has barely seen any vegetation recovery inside the fire boundary.
Finally, I wanted to look at the NDVI values for different years, instead of looking at the difference. We can see below that the upper right part of the fire has had the most vegetation regrowth, but still does not look like it did before the fire. And the lower left portion of the fire originally had less vegetation overall than the upper right area, but the vegetation has barely begun to become healthier/more abundant.
And their respective histograms which makes sense. In 2013, the values shifted lower as it was the year of the fire, and in present day, the values have shifted higher overall, but still are not similar to the year before the fire, 2012.
Results
It will take decades for the trees and vegetation to ever recover following the royal gorge fire. A research team from Australian National University found that forests’ ability to recover from a fire can stretching to more than 80 years. This means that we may continue to see devastated landscapes post-fire for many years to come, impacting the ability for wildlife to reemerge and humans to recreate in these areas.
A University of Colorado Boulder study noted that in the Southern Rocky Mountains the post-fire landscape is becoming unsuitable for future growth of ponderosa pine and Douglas fir. This finding from their research reveals that if fires continue to drastically harm the soil quality and ecosystem health, it may be hard for local trees to regrow in those areas.
Someday I hope to revisit the area, and hopefully in my lifetime it will look just like it did when I was a kid.
Data Citations
Didan, K. (2021). MODIS/Aqua Vegetation Indices 16-Day L3 Global 250m SIN Grid V061. NASA EOSDIS Land Processes Distributed Active Archive Center. Accessed 2023-10-06 from https://doi.org/10.5067/MODIS/MYD13Q1.061. Accessed October 6, 2023.
